top of page
Synthetic Data Generation Methods
Our approach to generating synthetic data from sensitive data in Trusted Research Environments (TREs)
There are many different techniques for generating synthetic data, typically either using statistical approaches or machine learning models to create new synthetic samples based on real data. Machine learning models are useful for modelling complex relationships and characteristics of real datasets, however, this can come with greater disclosure risks. For the majority of purposes of synthetic data for TREs, we don't need to capture this level of complexity, and can instead utilise statistical techniques.

The below details the statistical techniques used to generate synthetic data from population level summary statistics, to create synthetic data at three different fidelity levels:
Level 1 Structural - only uses datatypes and value ranges to generate synthetic data which looks structurally similar to the real data, but contains no statistical properties found in the real data.
Level 2 Statistical - uses the addition of distribution types and summary statistics to sample synthetic data from marginal distributions, therefore providing some level of statistical similarity, but does not capture relationships.
Level 3 Correlated - uses the addition of a correlation matrix to capture relationships between variables by sampling from multivariate distributions.

The process is split up into two parts - the processing, and the generation. This is so TREs can export the processed results through typical disclosure control methods before generating synthetic data. Making it easier to assess. (Add about threshold)
Explain whats needed / processed for each level
the best fit ditribution is identified, and the paramters calculated. below details the types of distributions and parameters fitted
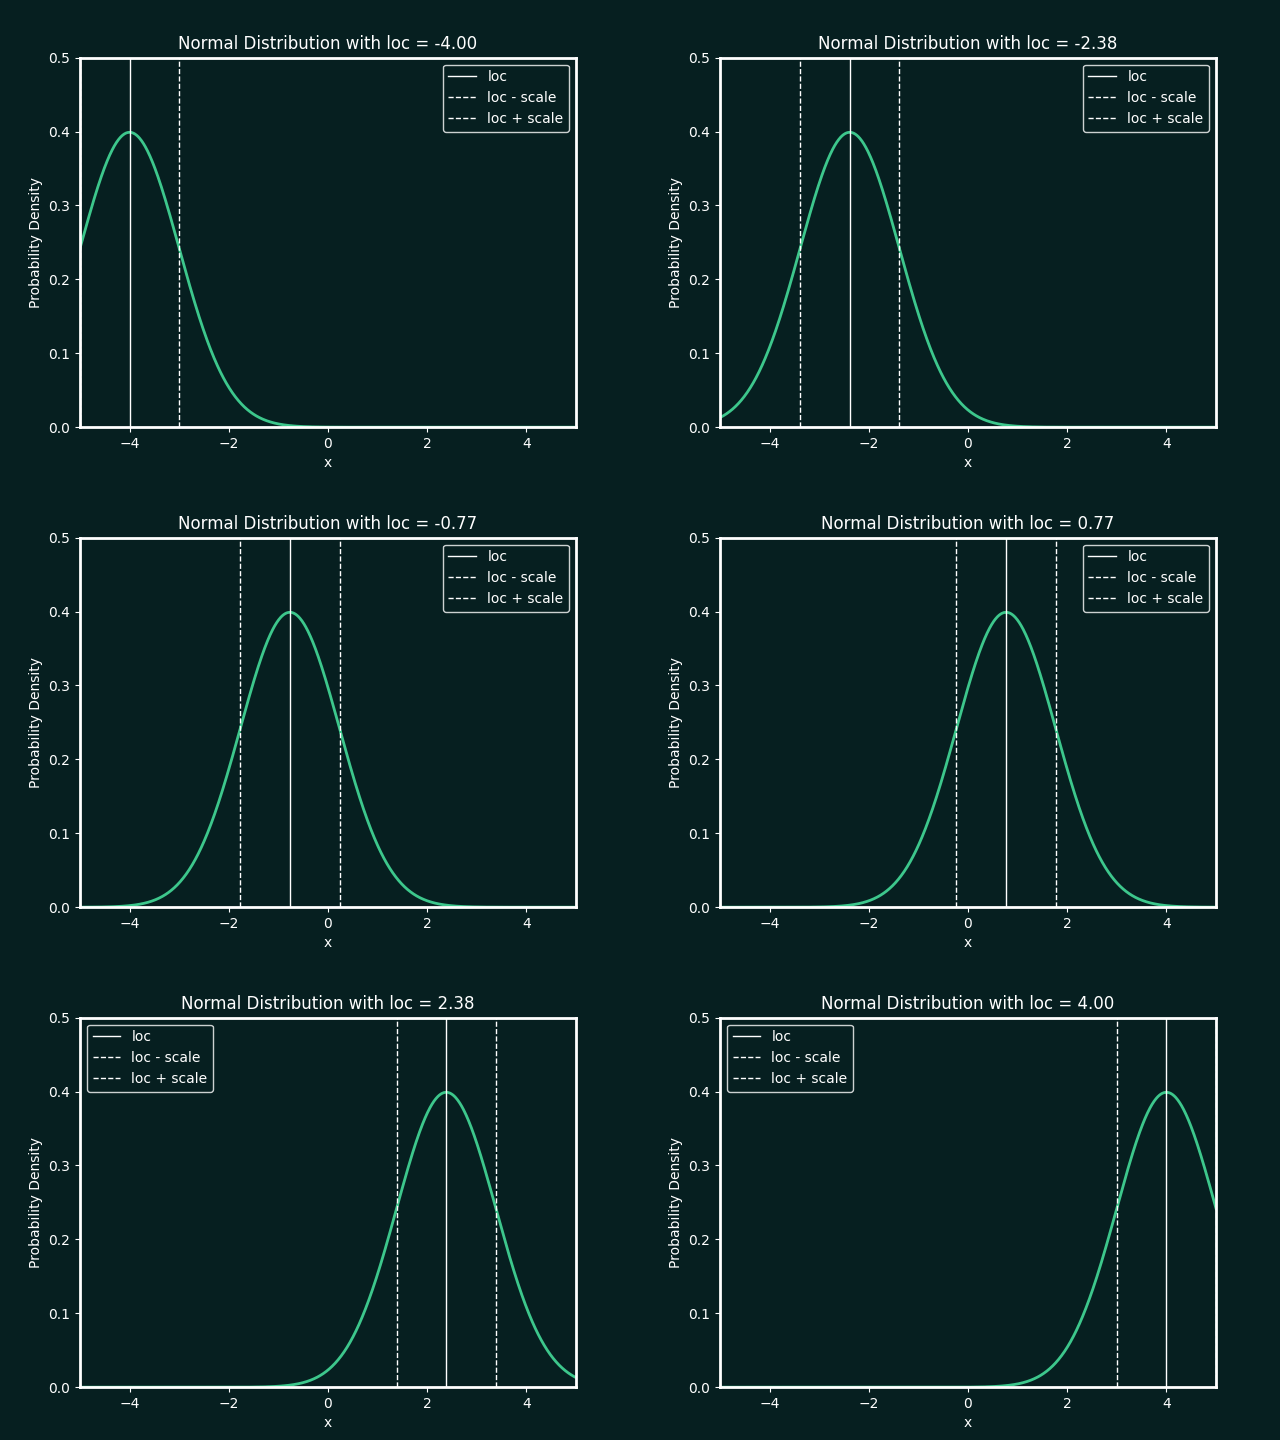
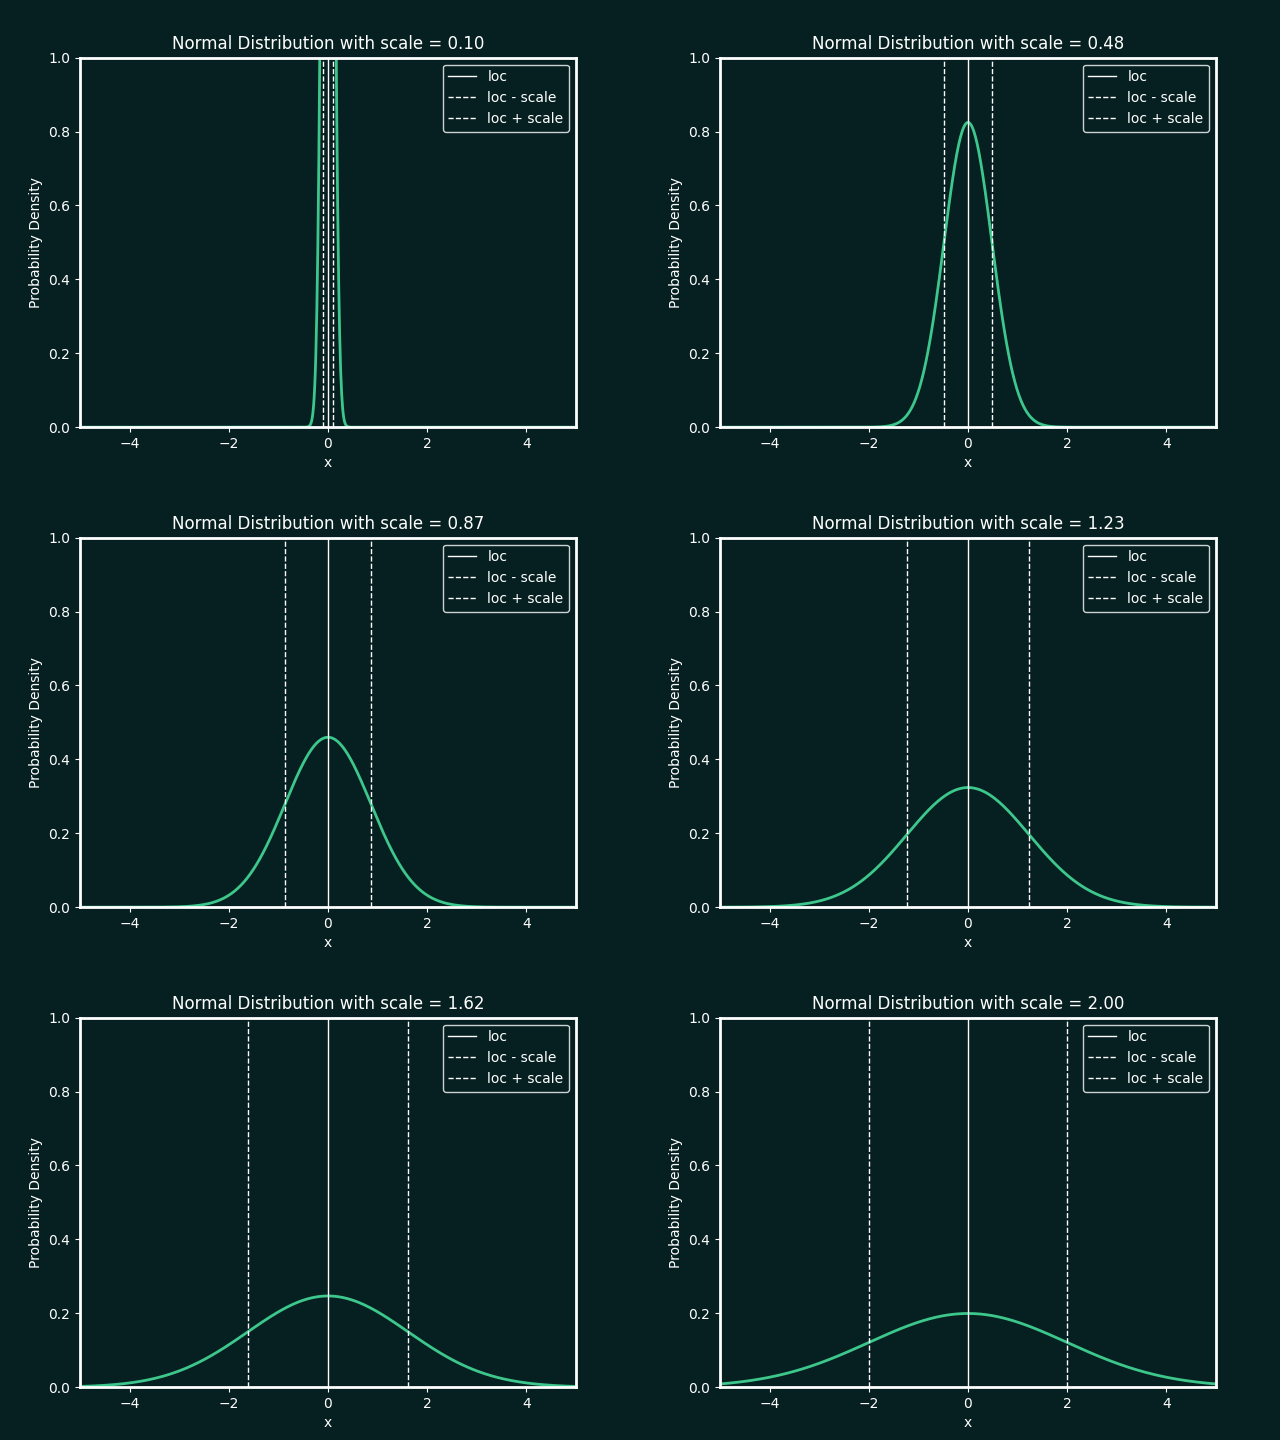
Normal Distribution
Parameters:
loc : The mean, or centre, of the distribution
scale : The standard deviation, which measures the spread of the distribution
bottom of page

